Each of the Golden Retrievers on this page have been DNA tested for genetic inbreeding by two or more of following five companies. The results show that some of the companies agree and some do not. Knowing who to trust when examining inbreeding of a dog is very important. We documented our own Red-Dawn dogs with multiple companies to educate the public. Very little data is published on the subject of how a single dog scores at multiple DNA companies when looking at inbreeding. We hope that this data helps educate you on the options. In addition, we have documented diversity vs inbreeding on many variety of dogs on this page: Genetic Diversity of Many Dog Breeds.
- Embark COI, coefficient of inbreeding (SNP)
- Wisdom Panel’s Optimal Selection, heterozygosity (SNP)
- Laboklin, heterozygosity (SNP)
- Feragen(SNP)
- UC Davis VGL IR, internal relatedness (STR)
- BetterBred interprets the VGL data
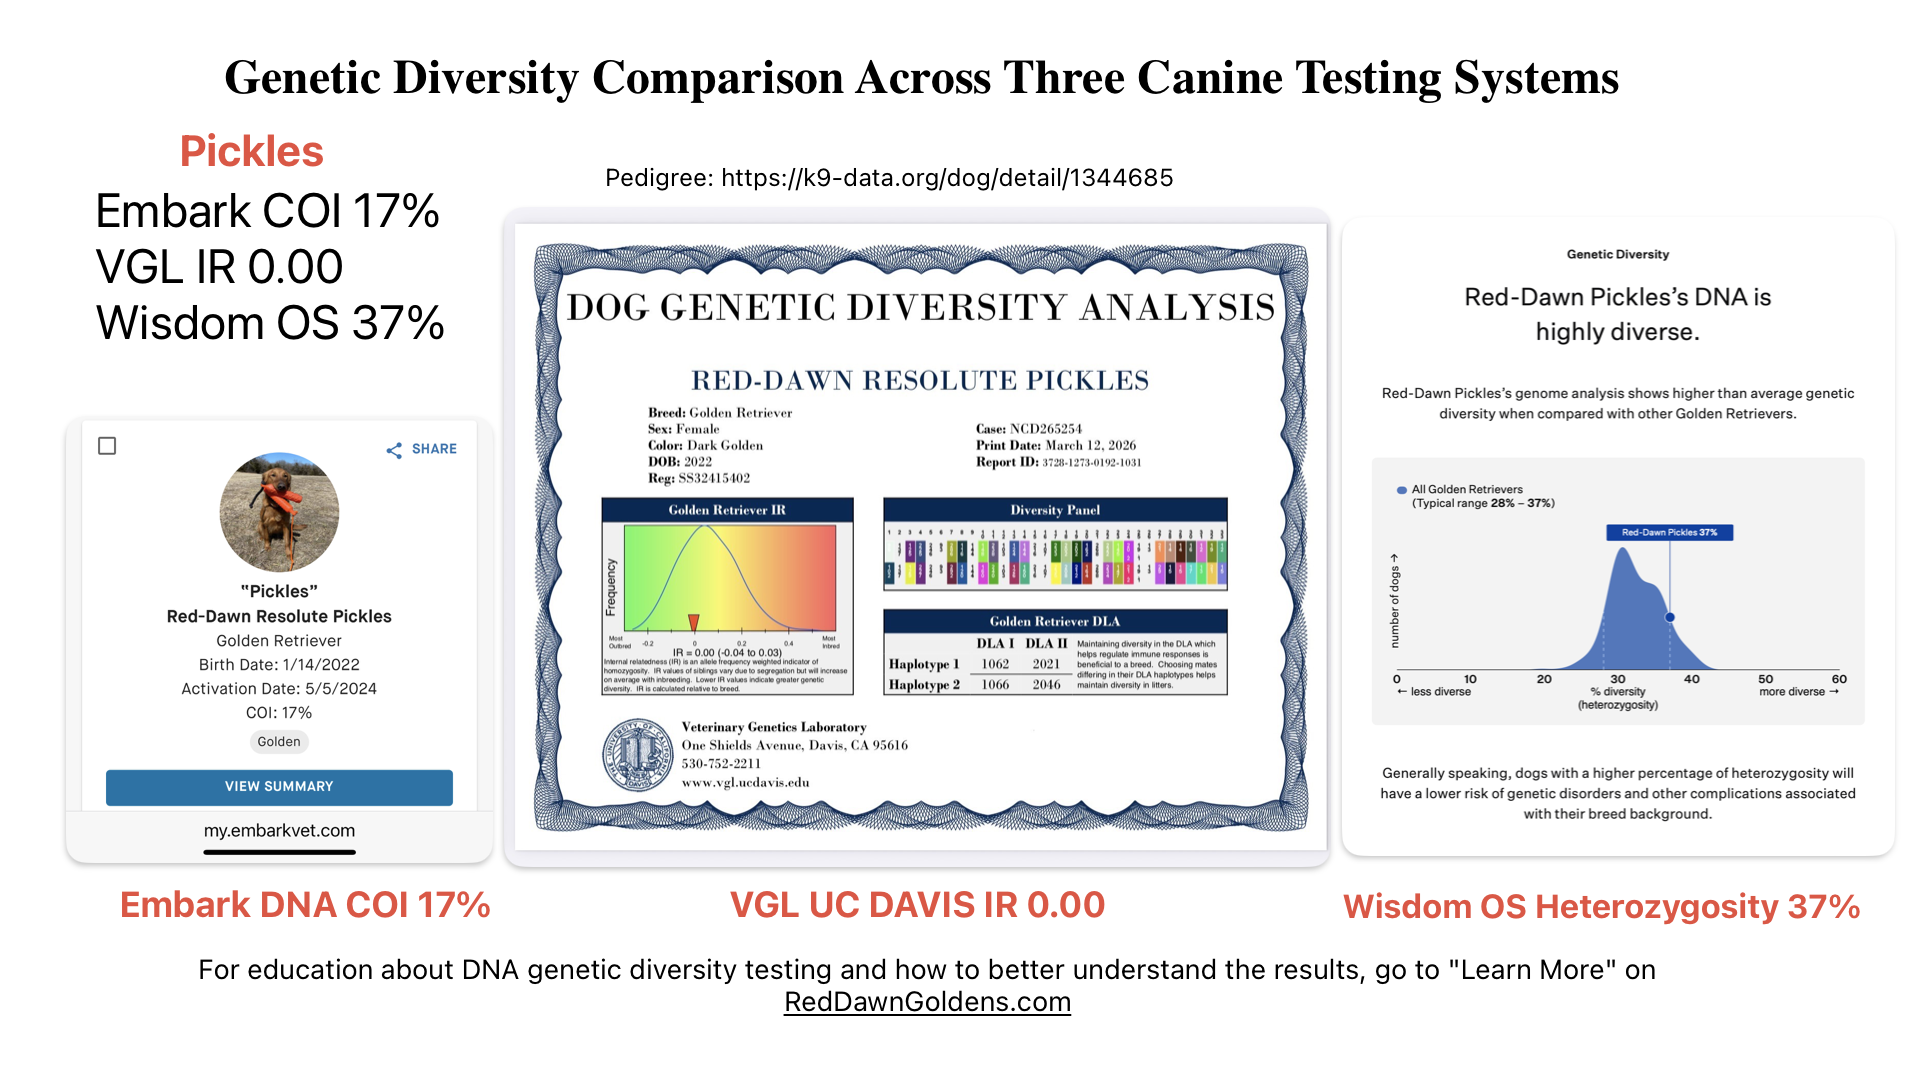
Pickles VGL, Embark, Wisdom OS Genetic Diversity results. She is a female Golden Retriever. Her Embark COI is in the yellow to green range, as is her VGL results. But her Wisdom OS says she is highly diverse. Her full sibling on this page is Charlton.
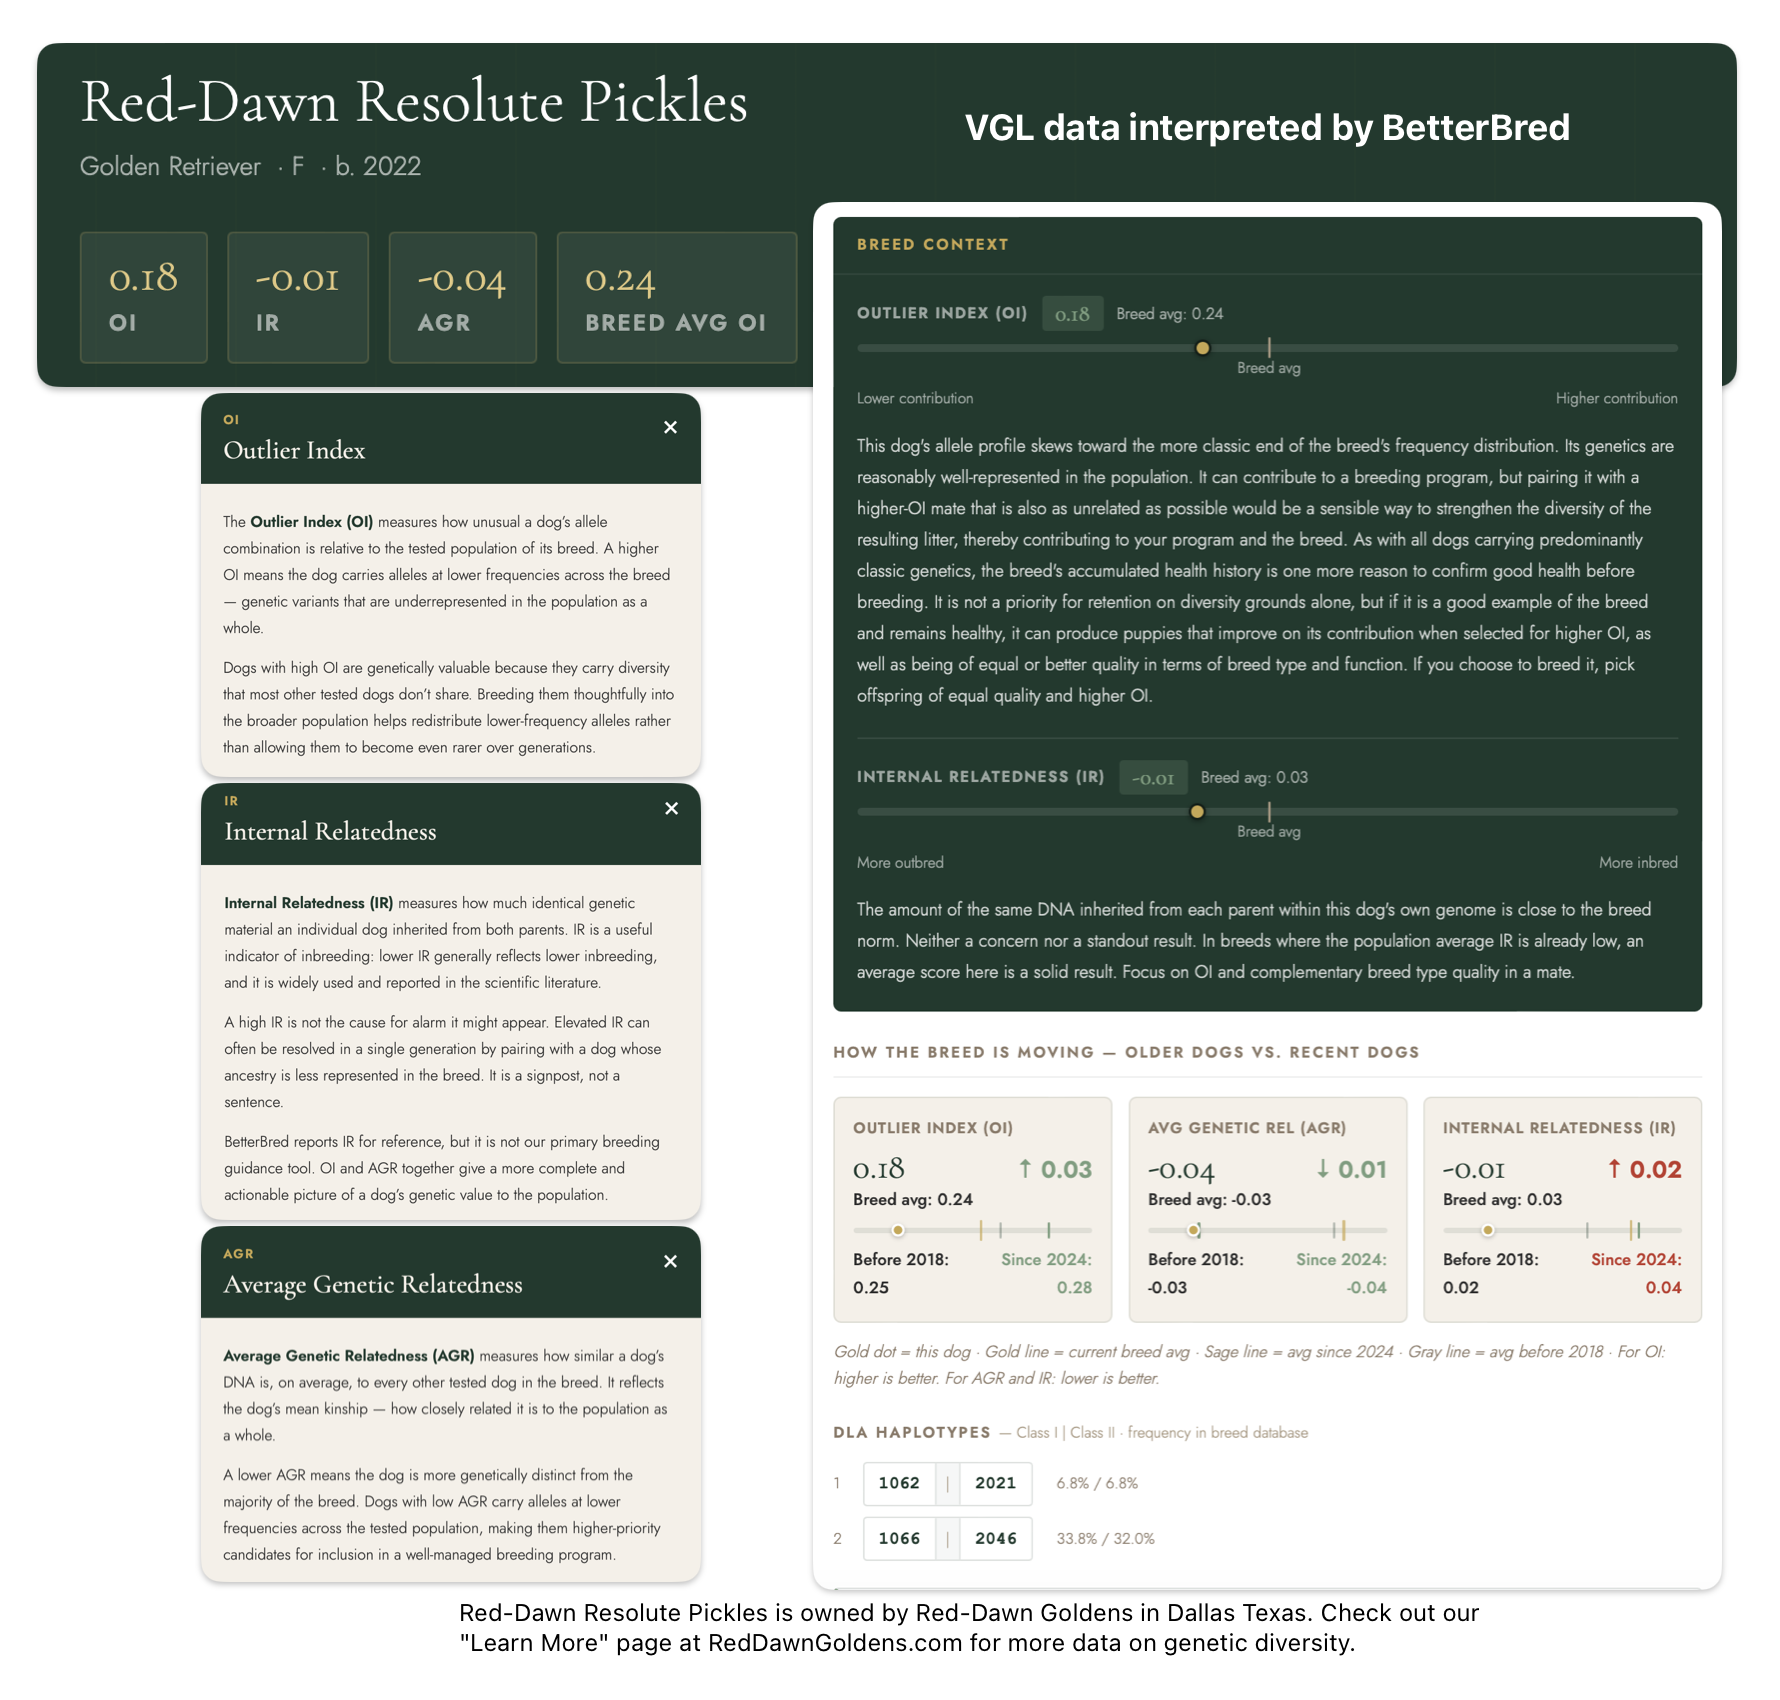
Pickles is genetic diversity tested at VGL and data interpreted by BetterBred
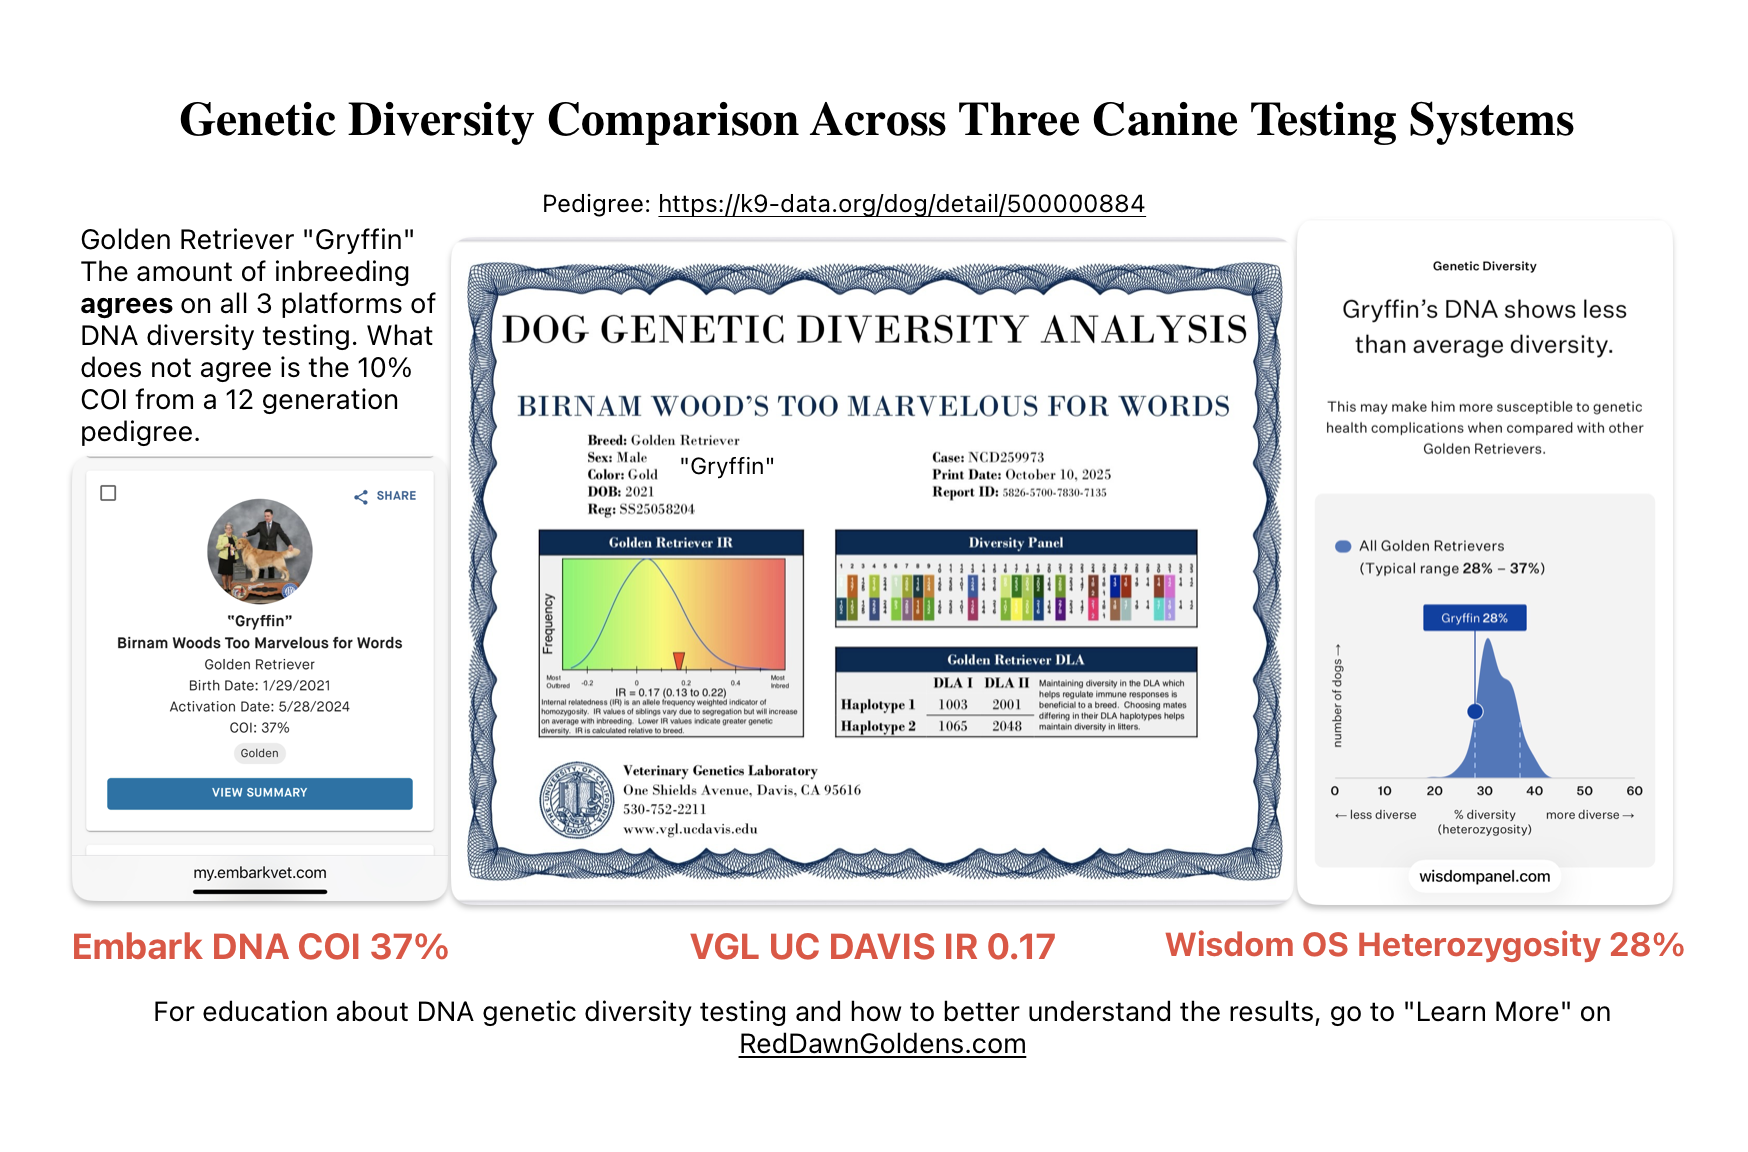
DNA genetic diversity testing of a male Golden Retriever, Birnam Woods Too Marvelous for Words, at UC Davis VGL, Embark and Wisdom Panel Optimal Selection companies

Birnam Woods Too Marvelous For Words overview of his VGL data by BetterBred
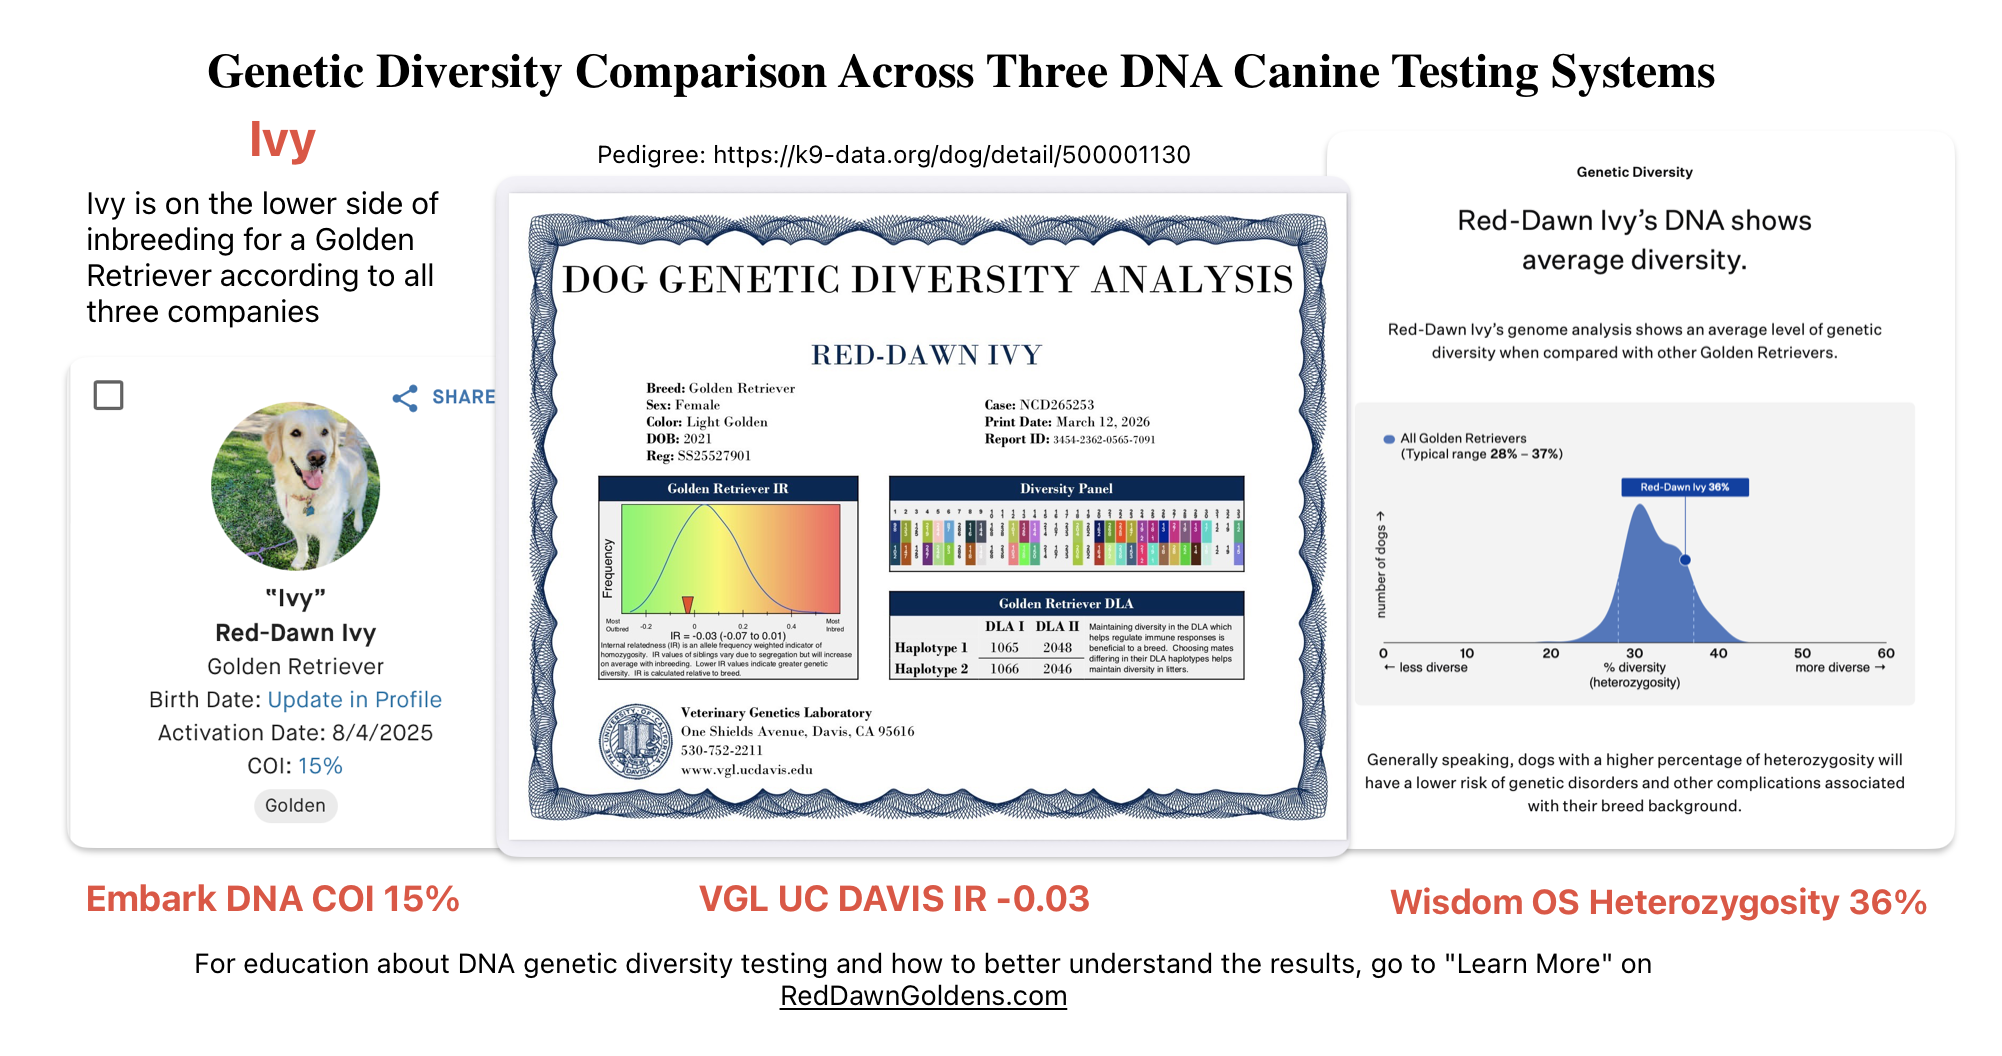
Red-Dawn Ivy a female Golden Retriever is tested at 3 DNA companies for inbreeding. She is on the lower side of inbreeding for the breed.
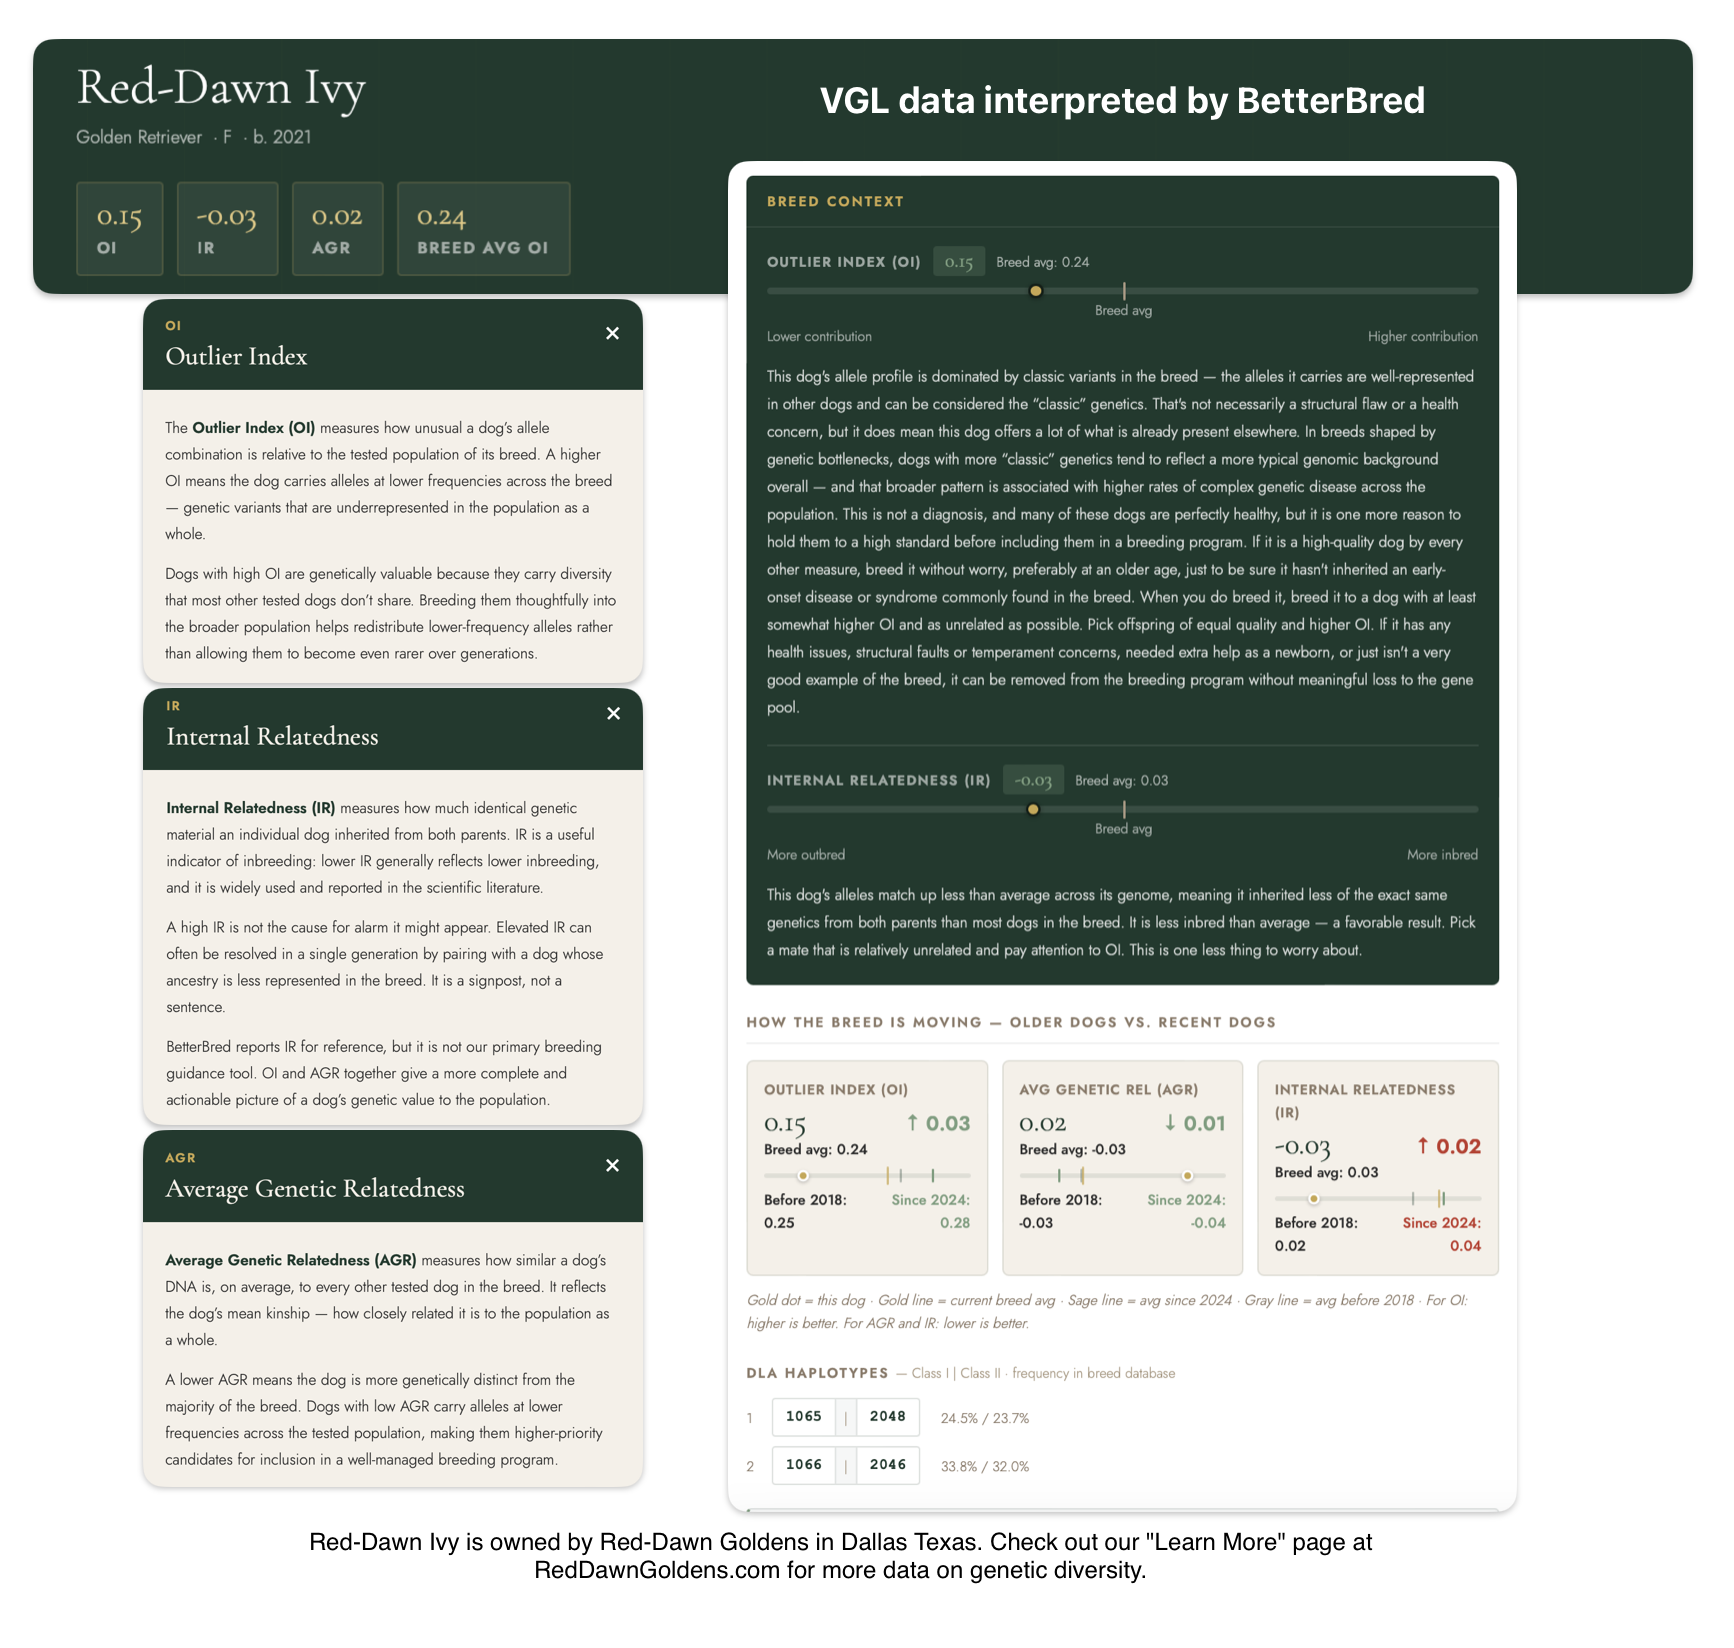
BetterBred overview of VGL data for a Golden Retriever, Red-Dawn Ivy
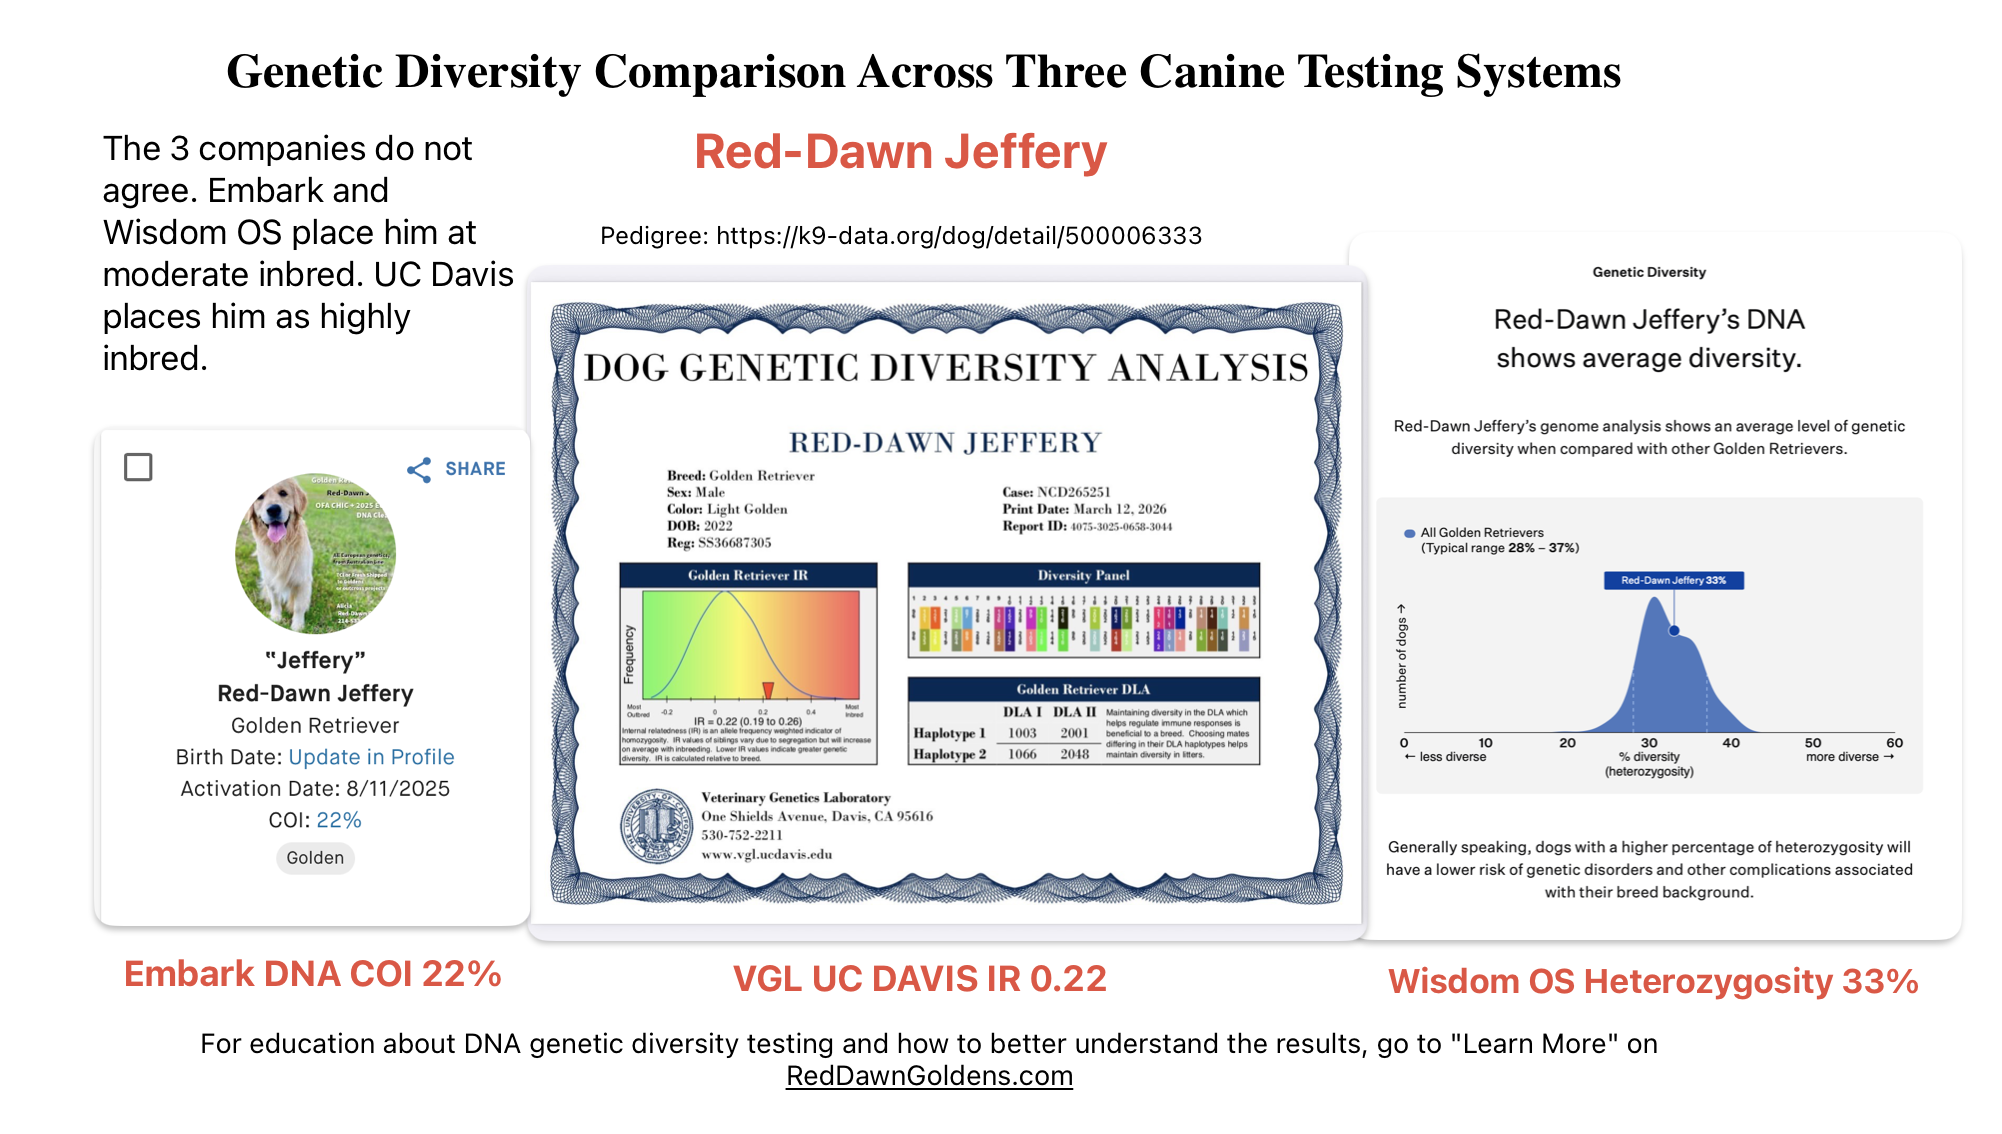
Jeffery’s DNA test do not agree how inbred he is! He is a golden retriever tested at VGL, Embark and Optimal Selection
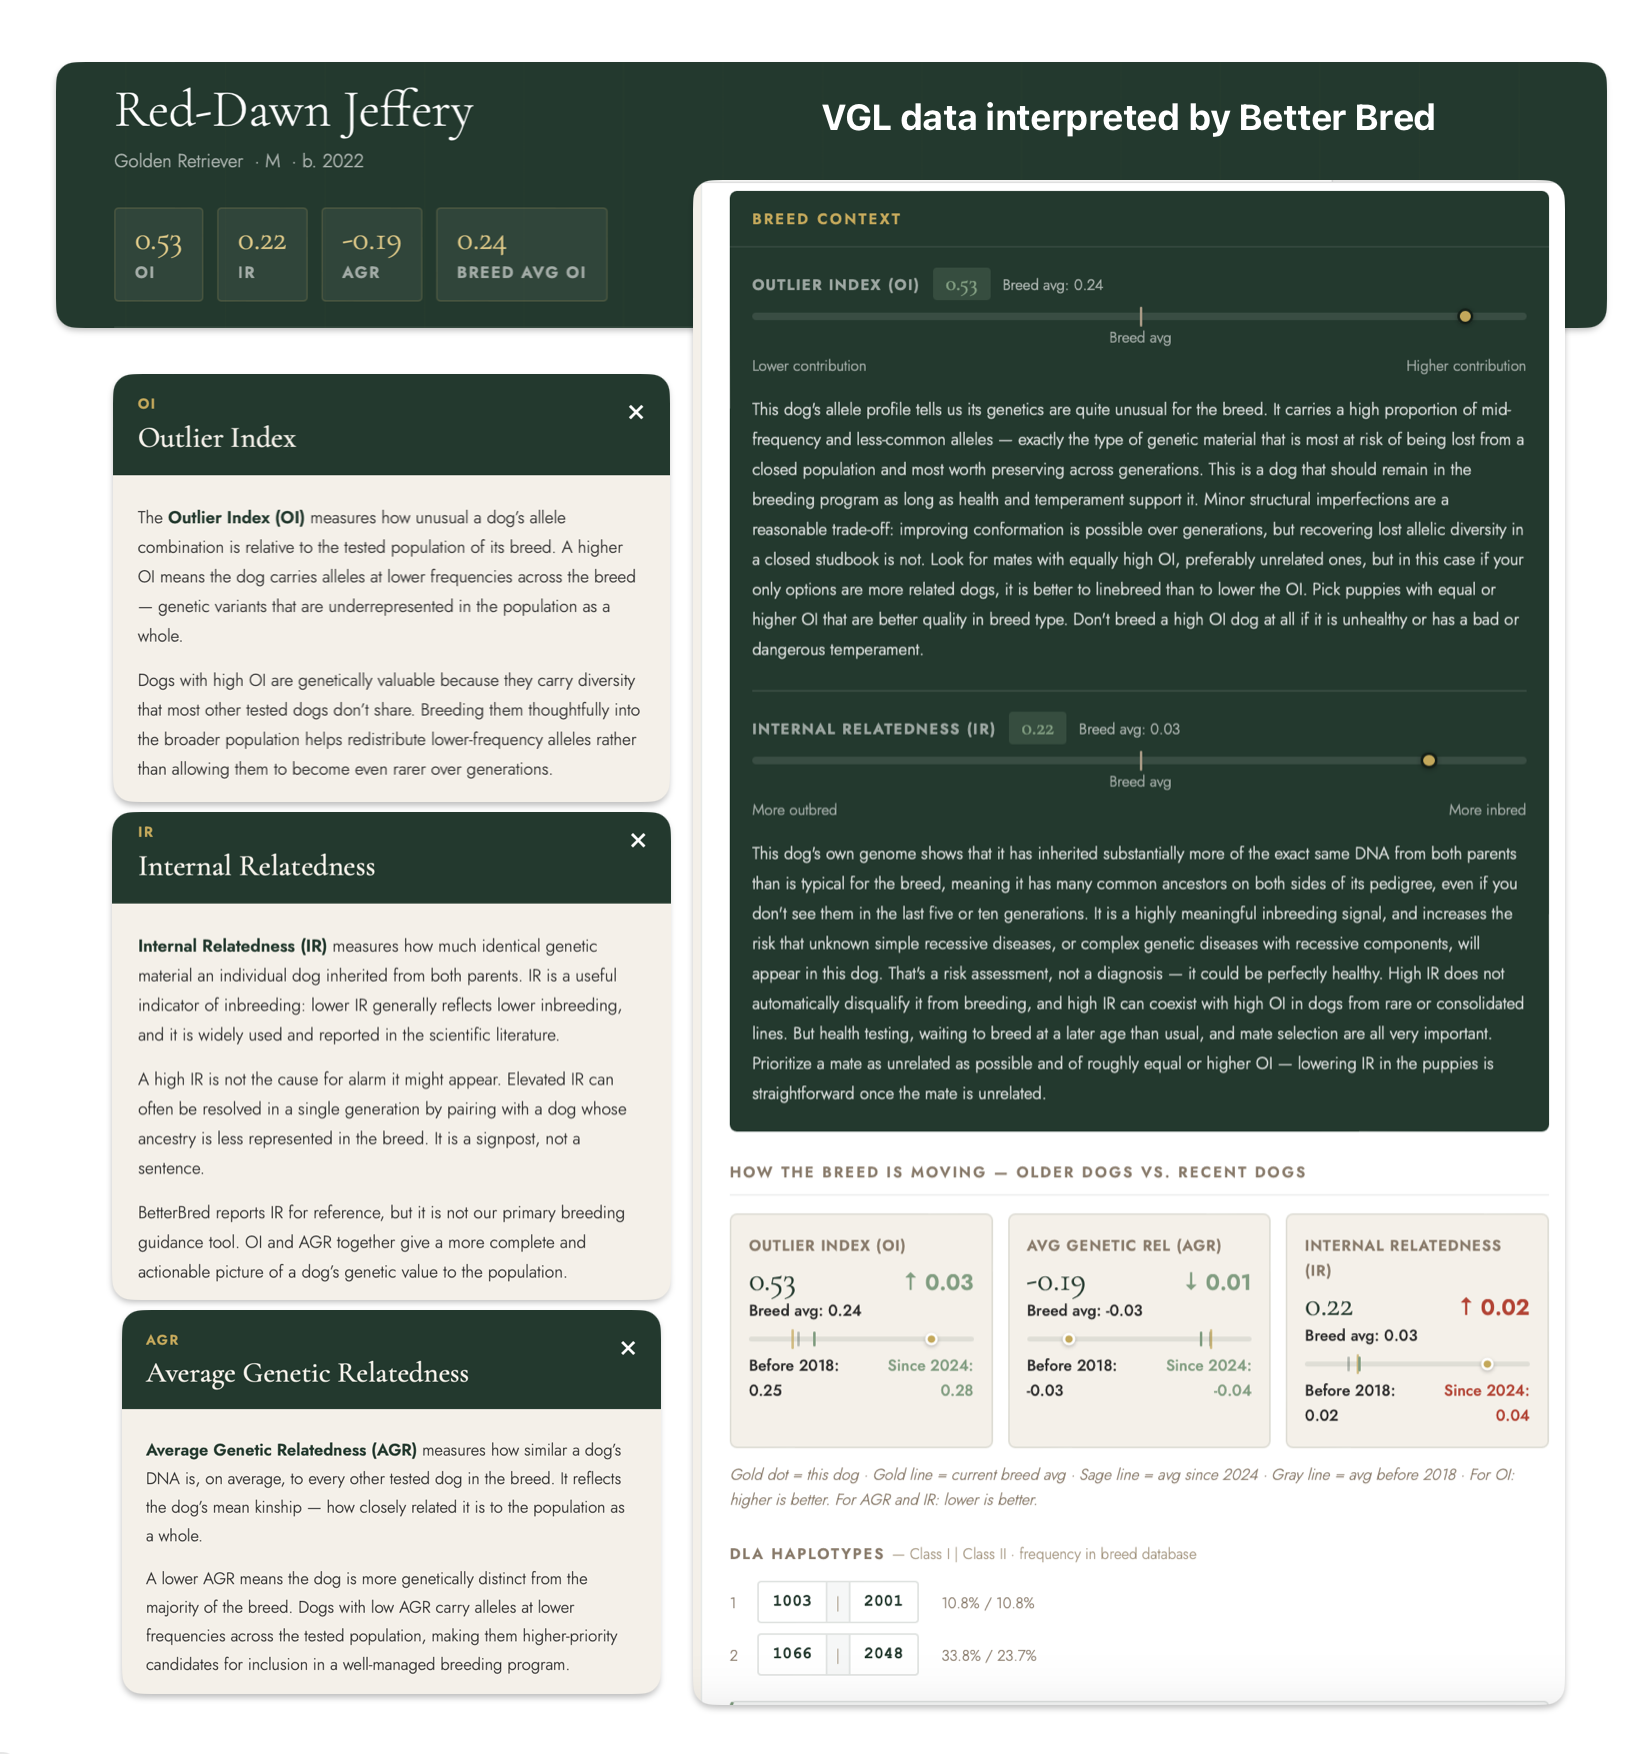
Red-Dawn Jeffery‘s BetterBred report from VGL data
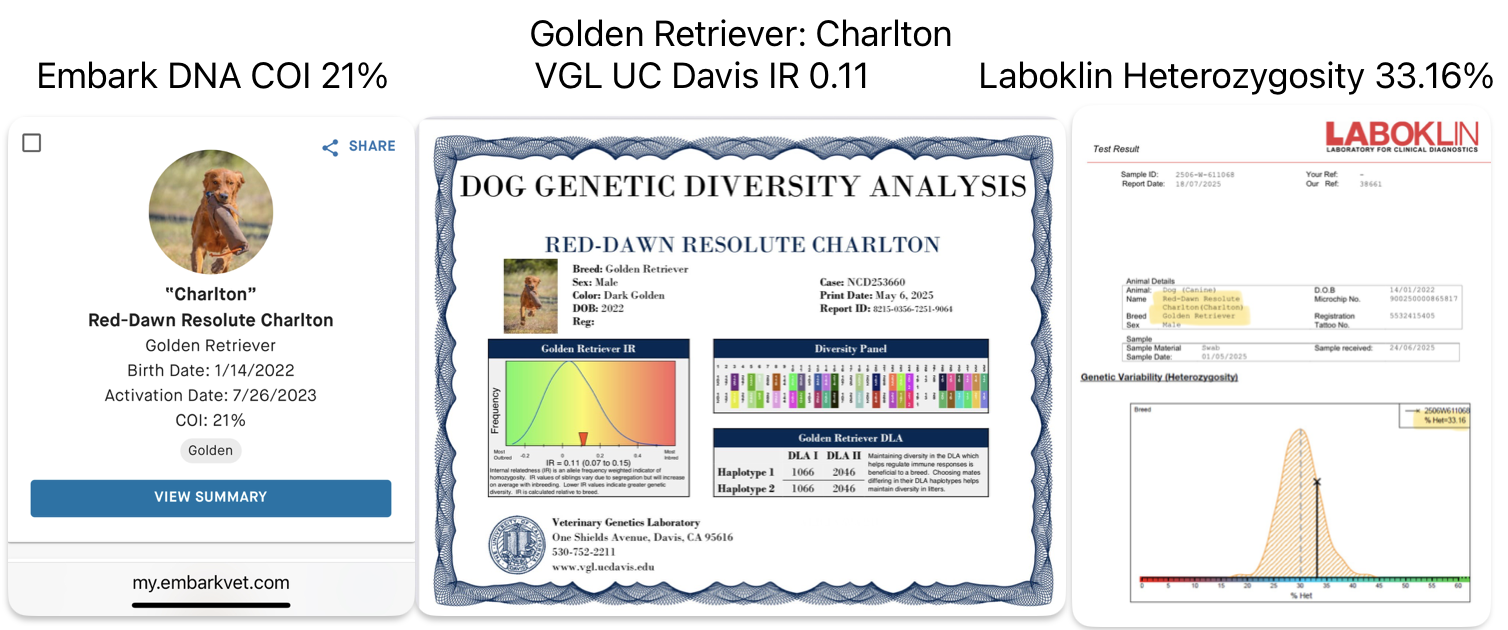
Charlton a Golden Retriever is tested at 3 DNA companies for genetic inbreeding. Embark and VGL all show he is moderately inbred. Laboklin says he is less inbred and more diverse. His full sibling on this page is Pickles.
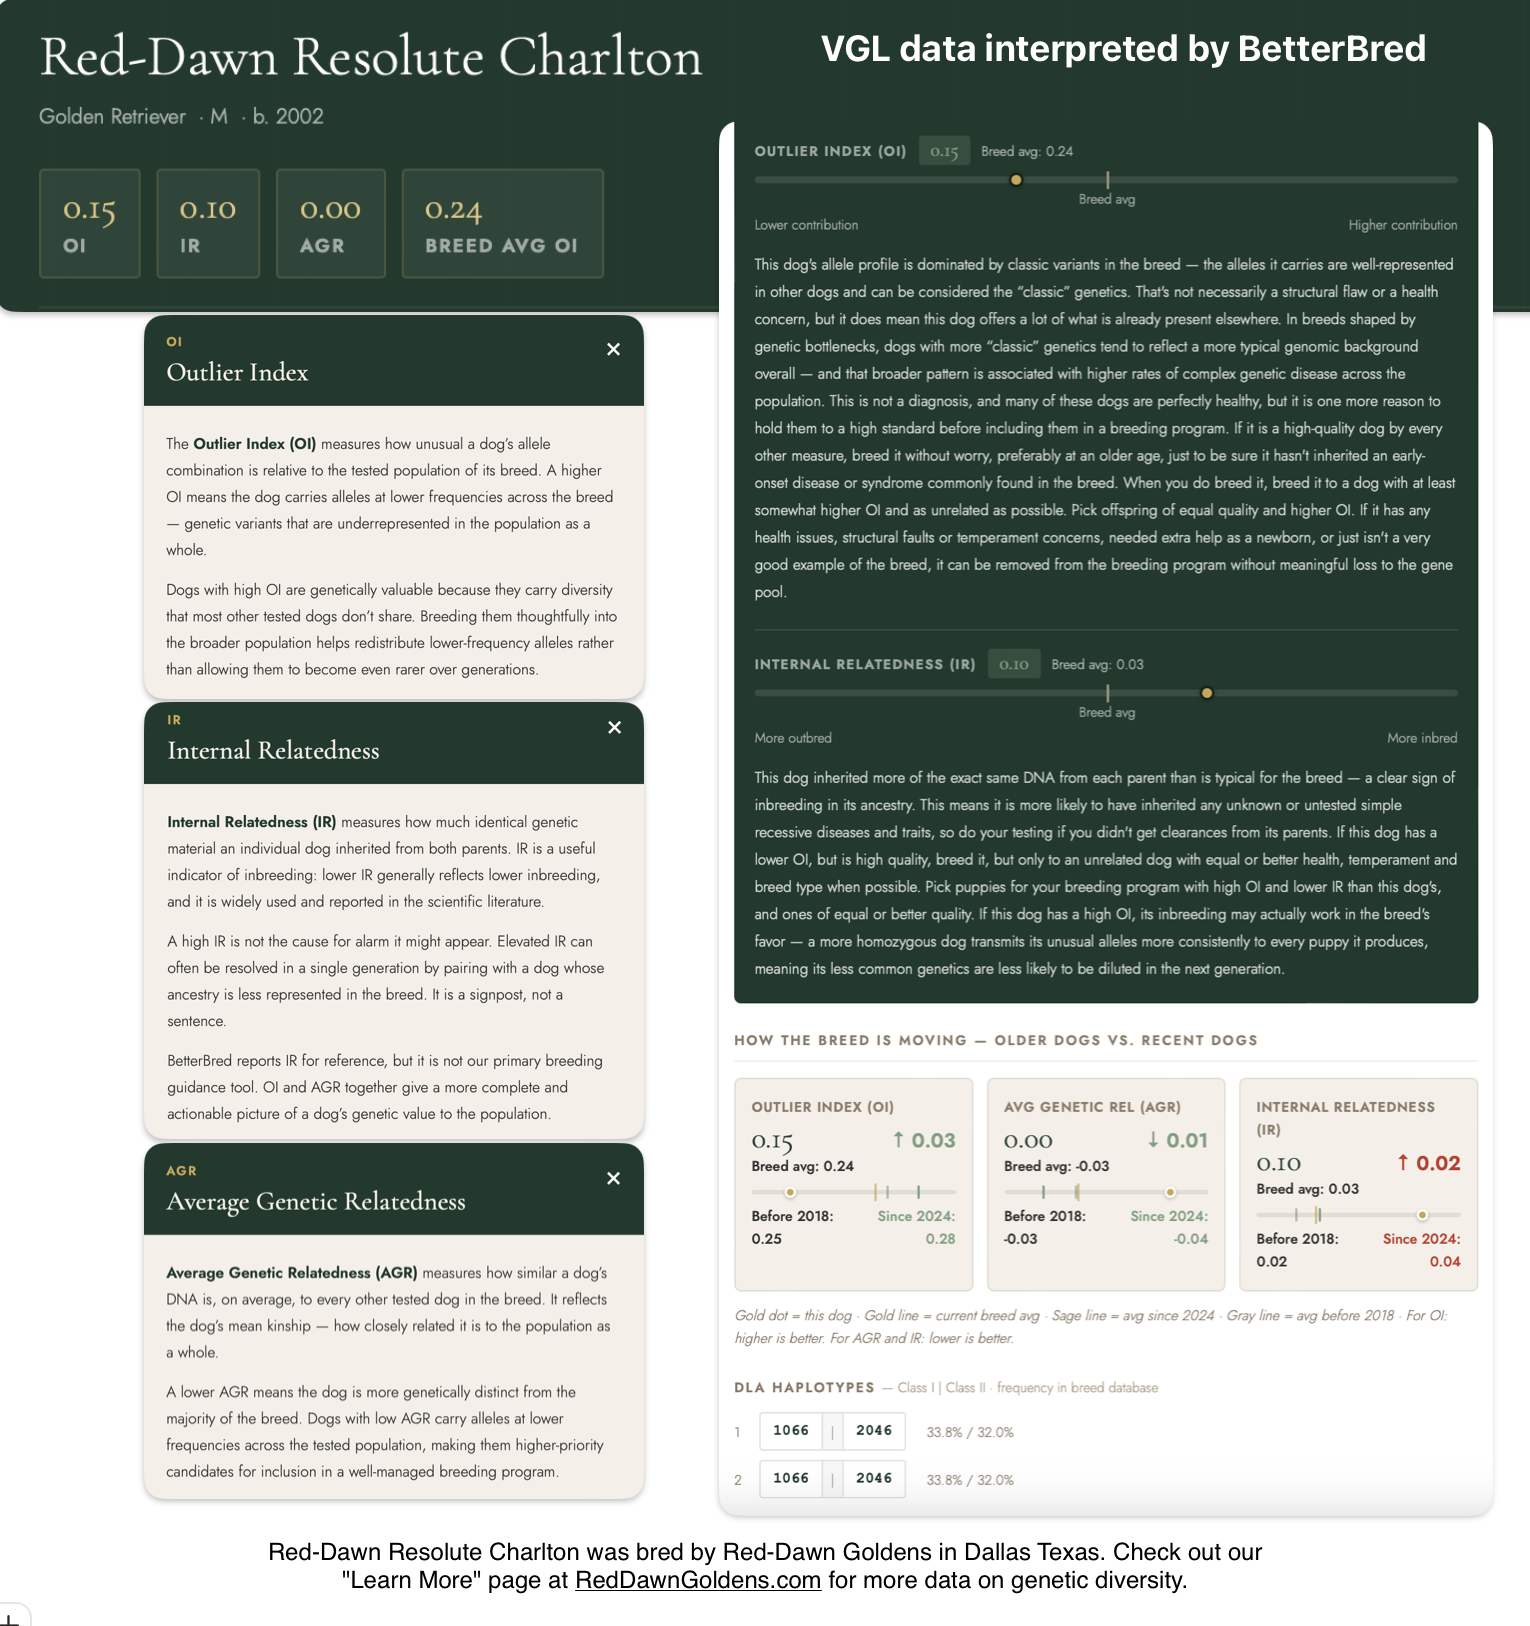
Red-Dawn Resolute Charlton a hunting bred Golden Retriever has his UC Davis VGL data interpreted by BetterBred to know details about his inbreeding
Wisdom Panel’s Optimal Selection, Laboklin and Feragen test a dog’s genetic Heterozygosity by evaluating the DNA. A higher score is better, like in Basketball. A lower score means more inbreeding is found in that dog. A higher heterozygosity score means the dog is less inbred or not inbred.
Heterozygosity of 45% is VERY GOOD
Hetrozygozity of 25-35% range is very common for many purebreds
Heterozygosity of 15% is VERY BAD
Embark DNA tests a dog’s inbreeding by looking at runs of homozygosity, called COI. A lower score is better, like in Golf. A higher score means more inbreeding is found in that dog. COI is the abbreviation for Coefficient of Inbreeding.
COI of 0-10% is VERY GOOD- Green – low risk
COI of 11-20 is Good – Green to Yellow – mild risk
COI of 21-30 is Poor- Yellow – genetic risks increased
COI of 30%+ is VERY BAD – RED – huge genetic risks
VGL UC Davis test shows IR, Internal Relatedness by evaluating homozygosity. As you can see in the colored graph, the lower the score the better (in the Green portion) and the higher the score the worse (in the Red portion). Think of IR as how Golf is scored, the low score is best.
To easily remember the differences between the platforms of DNA testing of genetic diversity:
COI = Golf, the lower the score the better (winner)
IR = Golf, the lower the score the better (winner)
Heterozygosity = Basketball, the higher the score the better (winner)
References
Zimmerman SJ, Aldridge CL, Oyler-McCance SJ. An empirical comparison of population genetic analyses using microsatellite and SNP data for a species of conservation concern. BMC Genomics. 2020 Jun 1;21(1):382. doi: 10.1186/s12864-020-06783-9. PMID: 32487020; PMCID: PMC7268520.
https://pubmed.ncbi.nlm.nih.gov/32487020/
This study shows that SNPs have three main advantages over microsatellites (STRs): they give more accurate measures of genetic diversity, better identify groups within a population, and can detect local adaptation. Overall, SNPs are becoming more useful for studying genetic diversity, especially in conservation.
Pérez-González, J.; Carranza, J.; Anaya, G.; Broggini, C.; Vedel, G.; de la Peña, E.; Membrillo, A. Comparative Analysis of Microsatellite and SNP Markers for Genetic Management of Red Deer. Animals 2023, 13, 3374. https://doi.org/10.3390/ani13213374
https://www.mdpi.com/2076-2615/13/21/3374
Both microsatellites (STRs) and SNPs gave similar overall results for population structure and genetic diversity. STRs were useful for getting a general picture of the population. However, SNPs were more precise, better at detecting subtle patterns, and could find relationships (like inbreeding effects) that STRs missed. Because of this, researchers recommend using SNPs when possible.
Vignal A, Milan D, SanCristobal M, Eggen A. A review on SNP and other types of molecular markers and their use in animal genetics. Genet Sel Evol. 2002 May-Jun;34(3):275-305. doi: 10.1186/1297-9686-34-3-275. PMID: 12081799; PMCID: PMC2705447.
https://link.springer.com/article/10.1186/1297-9686-34-3-275
DNA markers have become more important in animal genetics. Microsatellites (STRs) were widely used because they are easy to test and provide a lot of information. However, SNPs, despite having only two variants, have become more popular. This review explains why SNPs are now preferred and how they compare to other marker types.
Liu N, Chen L, Wang S, Oh C, Zhao H. Comparison of single-nucleotide polymorphisms and microsatellites in inference of population structure. BMC Genet. 2005 Dec 30;6 Suppl 1(Suppl 1):S26. doi: 10.1186/1471-2156-6-S1-S26. PMID: 16451635; PMCID: PMC1866760.
https://pmc.ncbi.nlm.nih.gov/articles/PMC1866760/
SNPs are widely used to study genetics, but they are often compared to microsatellites (STRs). In this study of 236 people, researchers analyzed 328 STRs and 15,840 SNPs. Each STR was about 4–12 times more informative than a single SNP. However, because there were so many more SNPs, they provided better overall results for understanding population structure.